For over 10 years, MME has tracked the time it takes for biopharmaceutical products to move between regulatory and pricing approvals in the US and EU5. Based on our periodic data cuts, we have observed differences in both if, and when, products reach the market. While some of these differences are a result of how the procedures work in the individual countries, others are more nuanced and change based on the particular country and circumstances.
Recently we decided to analyze similar 3 year cohorts for all products+, as well as oncology and orphan drugs separately, in order to understand not just the overall statistics, but to look for changes in trends. What we uncovered is that there are distinct differences – most notable are the following key takeaways (refer to Figure 1 and Table 1 at end of article):
- For all products including oncology and orphan meds, the US is fastest for time to market.
- For EU5, trends analysis over time reveals a few differences:
- In France, Italy and Spain, where the procedures require a local filing and negotiation before entering the market, the time between regulatory and pricing approval is longer (albeit declining) and the number of products to make it through the process varies. Between the time cohorts we see declines in time to market for all three countries, but this is offset by fewer percentage of approved drugs being launched to date in the more recent years. This seems like the decreases might be “false positives” until a number of the remaining products complete the process.
- Procedures in Germany and UK result in a short time from regulatory to pricing approvals. While in Germany the overall trend is fairly stable; in the UK, time to market for orphan drugs tends to be longer vs. all drugs, while oncology is generally faster.
Stay tuned for further updates as we continue to report the results from our analyses. In the meantime, we encourage you to please contact us to discuss these results in greater detail and how they may factor into your PRMA decisions and market expectations. We are ready and here to help.
Figure 1: Average time to market from regulatory approval to launch in the US, EU4 and the UK
Trend toward decrease in average time to market seen in France and Spain
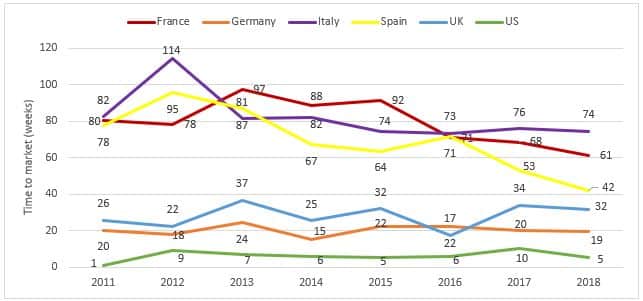
Table 1: Average Time to Market Differences for All/Oncology and Orphan Drugs: Subset selected 2011-2014 and 2015-2018
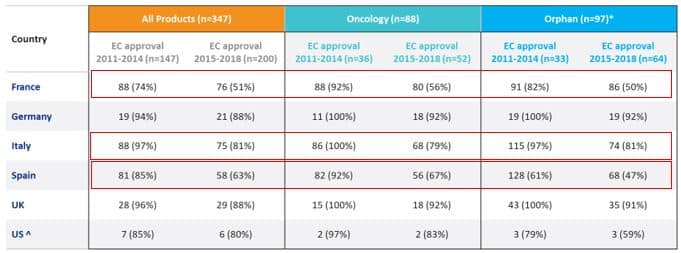
*97 medicinal products had orphan designation (OD) at launch; 11 have lost OD over time, while 86 maintain status
^US: FDA approved drugs 2011-2014= 125 and 2015-2018=159
Cut-off date for data collection was Sep 2020; Data was gathered from official national HTA agencies and P&R bodies
+New molecular entities, formulations and combinations approved by the EC within the specified time periods; availability and commercialization timelines in US were also analyzed for the same products to establish number/percentage of medicinal products approved by the EC but not FDA